|
|
||||||||||||
|
|
|||||||||||
|
Fault
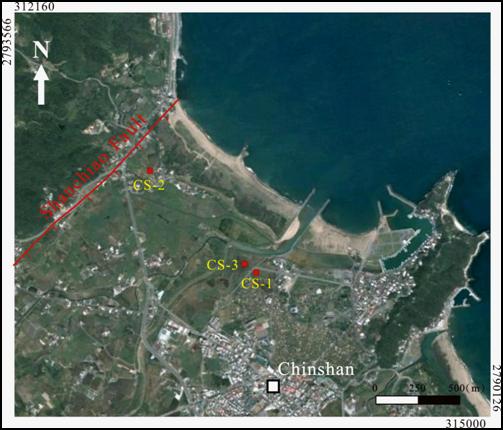
Trace of Shanchiao fault extended from Shanhsia to Kuantu
along the west margin of Taipei basin and then pass through the Tatun
volcano. Fault trace in the Tatun volcano area is covered by colluvium
or vegetation so there are many arguments about it. But as it extends to
Chinshan plain it is conformed by the linear scarp in the
north(figure.1).
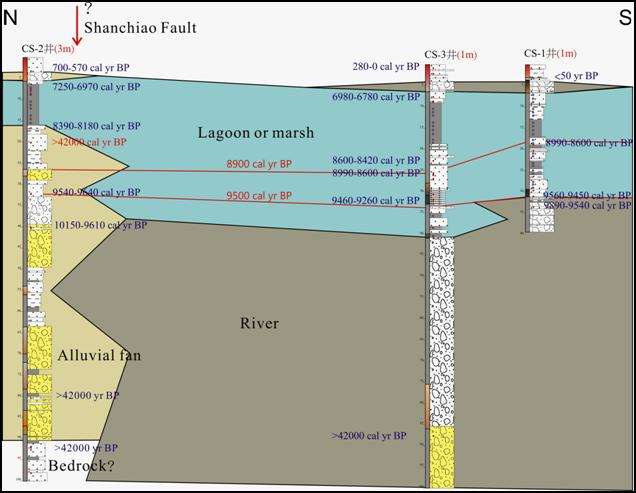
By the
analysis of 3 core-boring data in Chinshan plain it presents it was a
subaerial river environment before 8390-8180 yr BP, then the sea water
flooded the land to form brakish lagoon environment in CS-2 (figure.2).
But from CS-1 and CS-3 it presents the sea water flooded into the basin
before 9560-9450 yr BP in the central part of the plain. The timing
delay of the flooding event in CS-2 might relate to the colluvium
deposited from the nearby fault scarp which make it a topography high.
After Late Holocene ( 6,000 yr BP) the eustatic sea level reaches a
stable condition and the fluvial deposit gradually prograded to the
coastal area.
From the
dating and paleoenvironment of the CS-3, we estimate the long term crust
deformation rate as follows: the CS-1 has a mean 0.7±0.5 mm/yr uplift
rate. The CS-2 has a mean 0.3±0.6 mm/yr uplift rate and 0.6±0.6 mm/yr if
ignorance of -1.0±0.7 mm/yr. The CS-3 has a mean -0.4±0.6 mm/yr
subsidence rate. These 3 sites display no obvious vertical crust
deformation, just CS-3 displays a slight subsidence. Chinshan plain and
Taipei basin might be in the hanging wall of Shanchiao fault, and be
part of a half graben structure. The subsidence rate will be getting
larger as close to the fault trace and getting smaller or converse to
uplift as away from fault trace. CS-1 and CS-3 sites in the south area
of the plain display a little uplift and subsidence rate. The phenomenon
agrees with the half graben structure. But the CS-2 which is closest to
the fault trace display a subtle uplift, we suggest the site might be
located in footwall (figure.2).
Figure.1 Localities of core-boring site in Chinshan plain. (aerial photo extract from “Google Earth” website)
Figure.2 Cross-section of Chinshan plain constructed by core-boring data.
|
||||||||||||